Infographics
Publish-ready infographics, from your data.
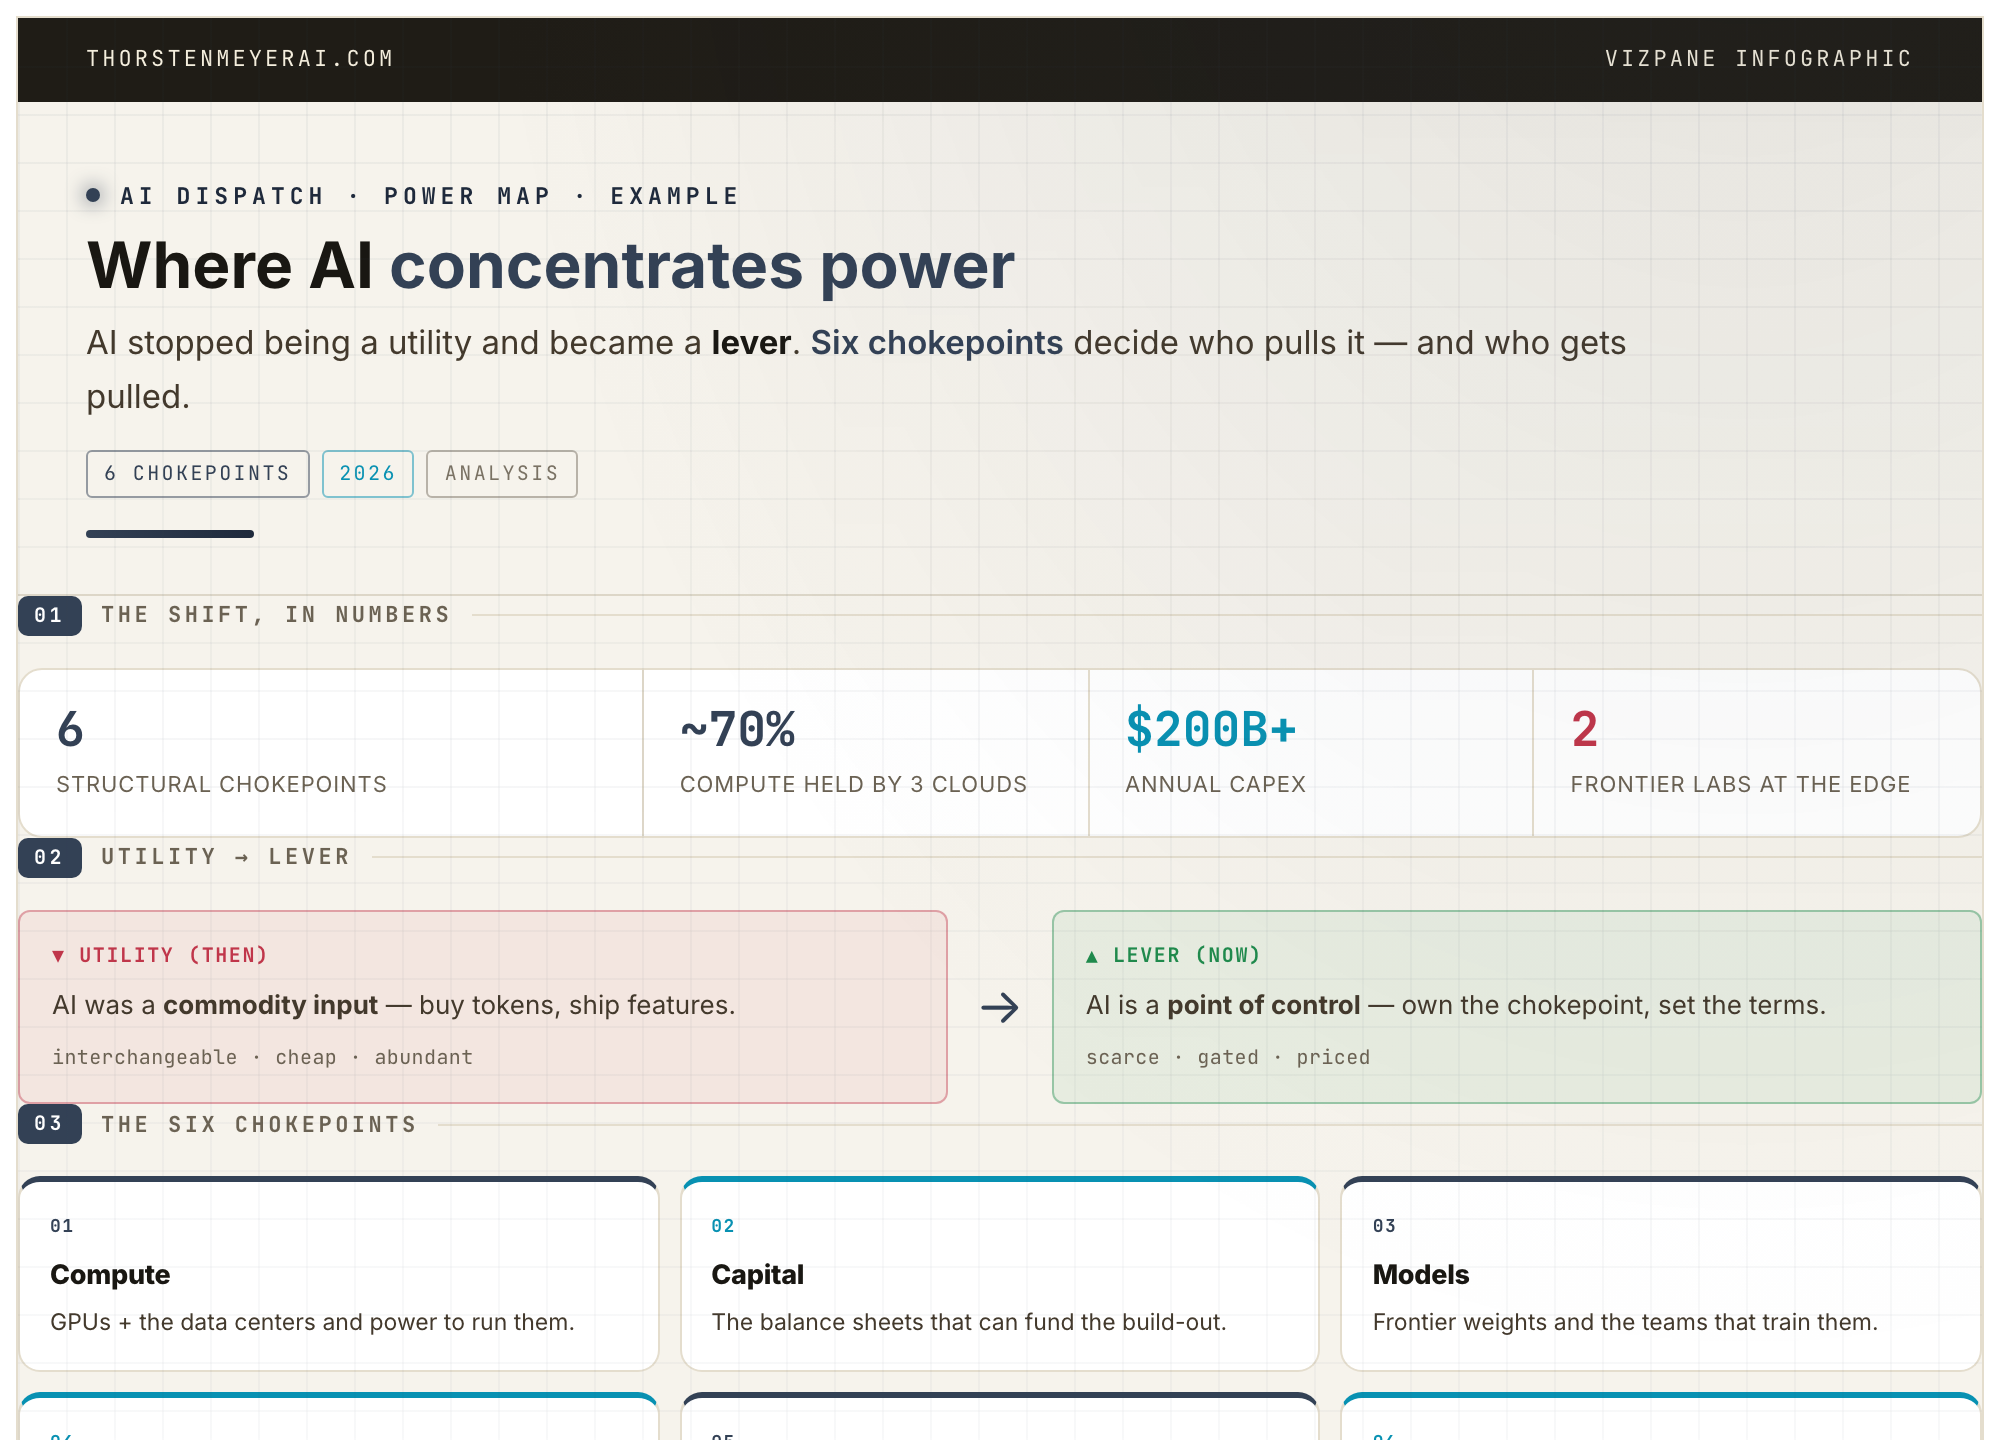
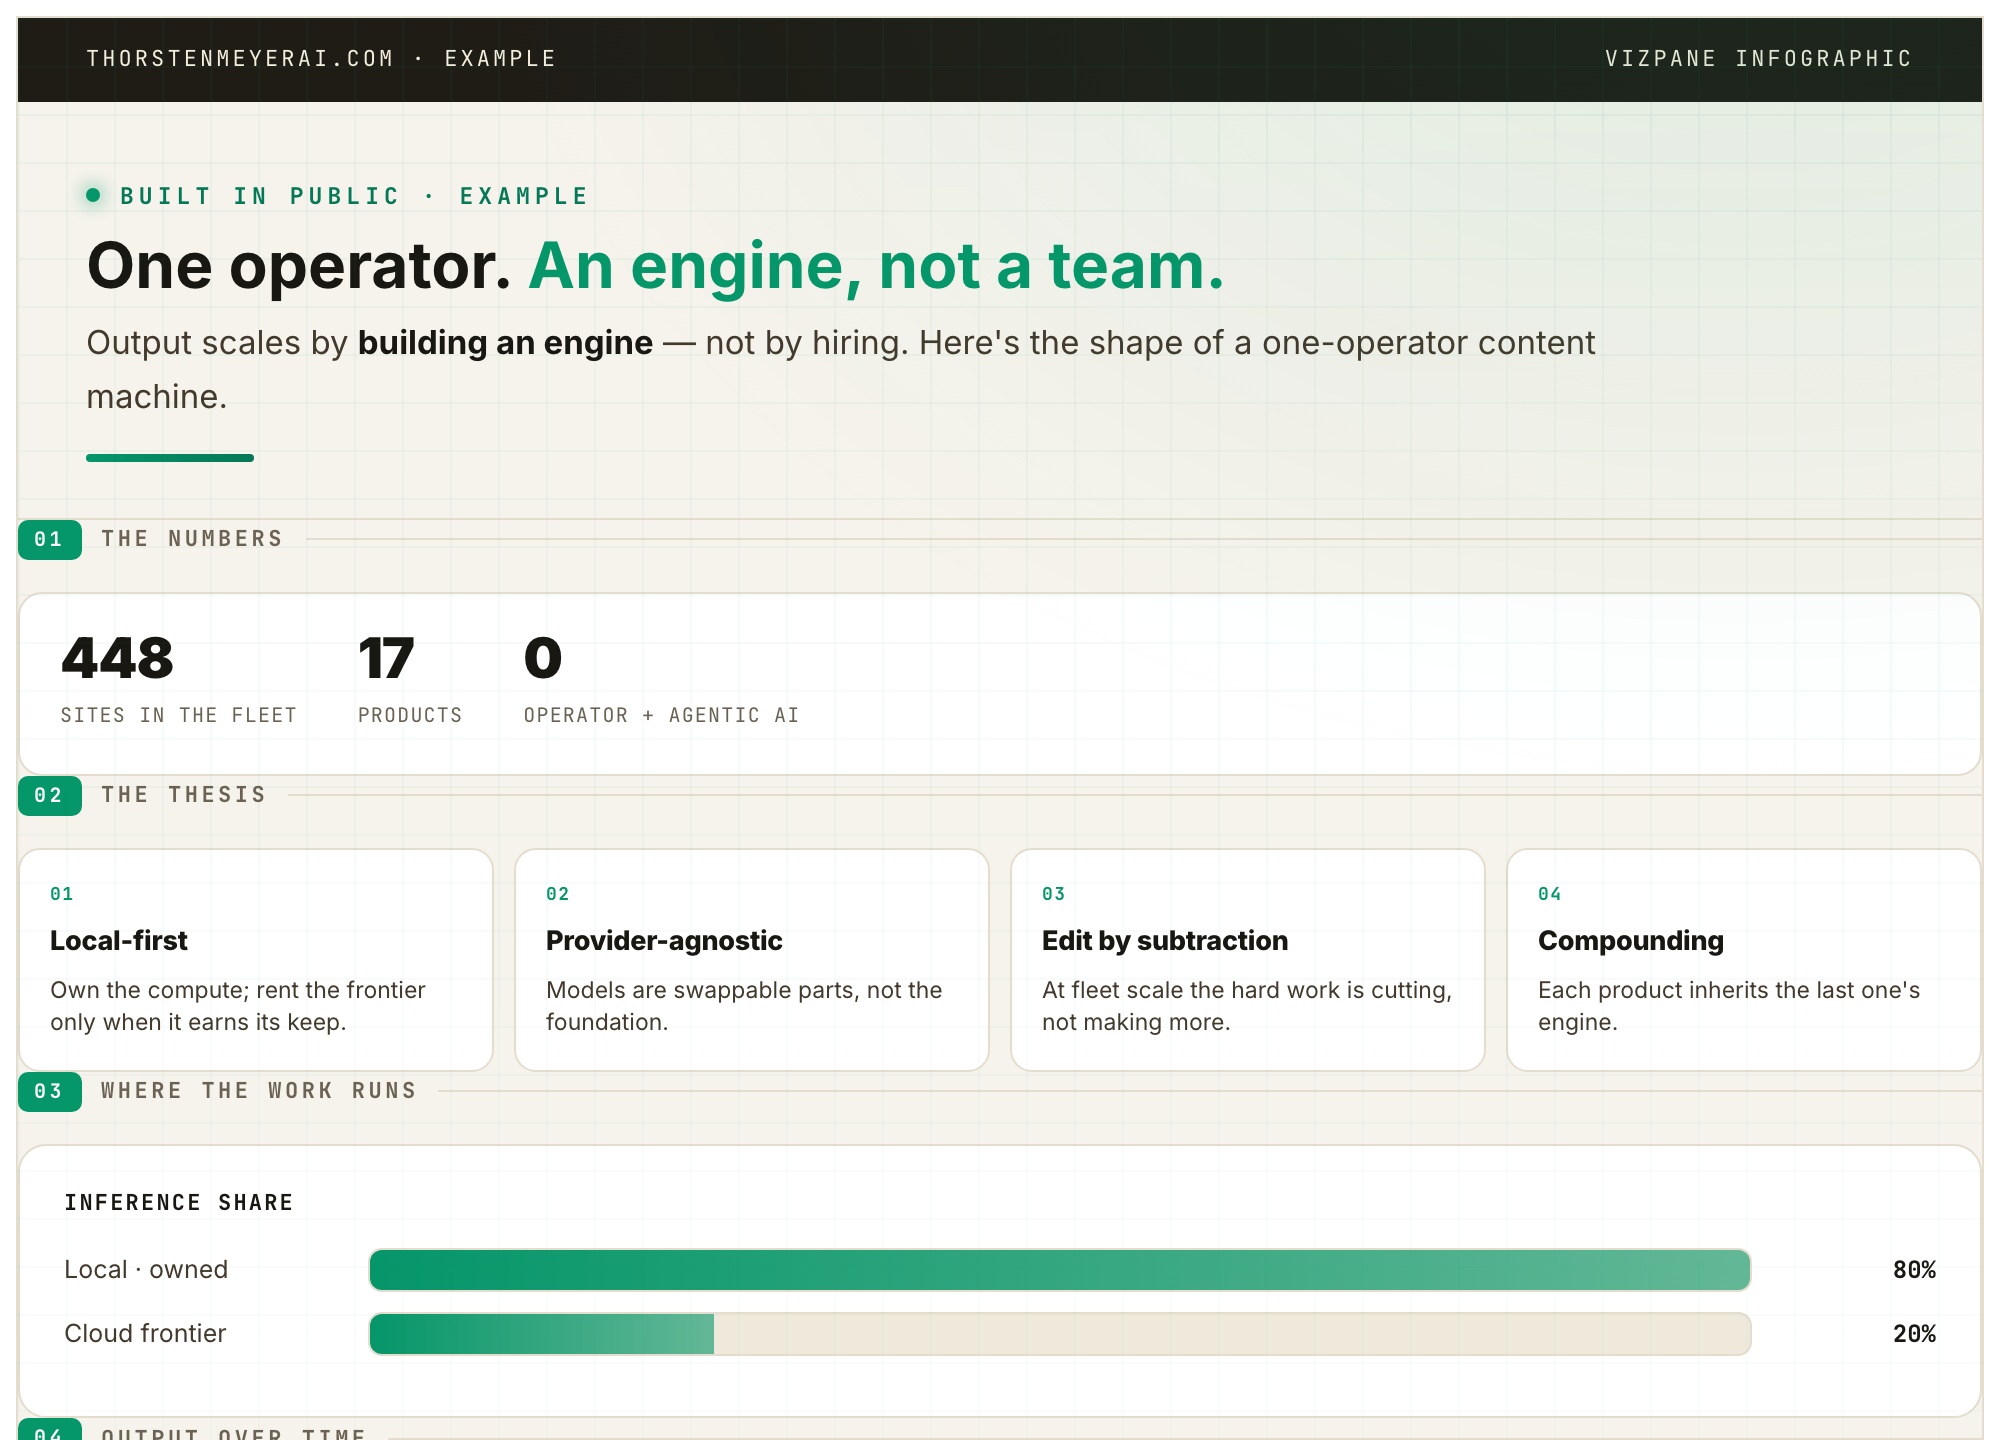
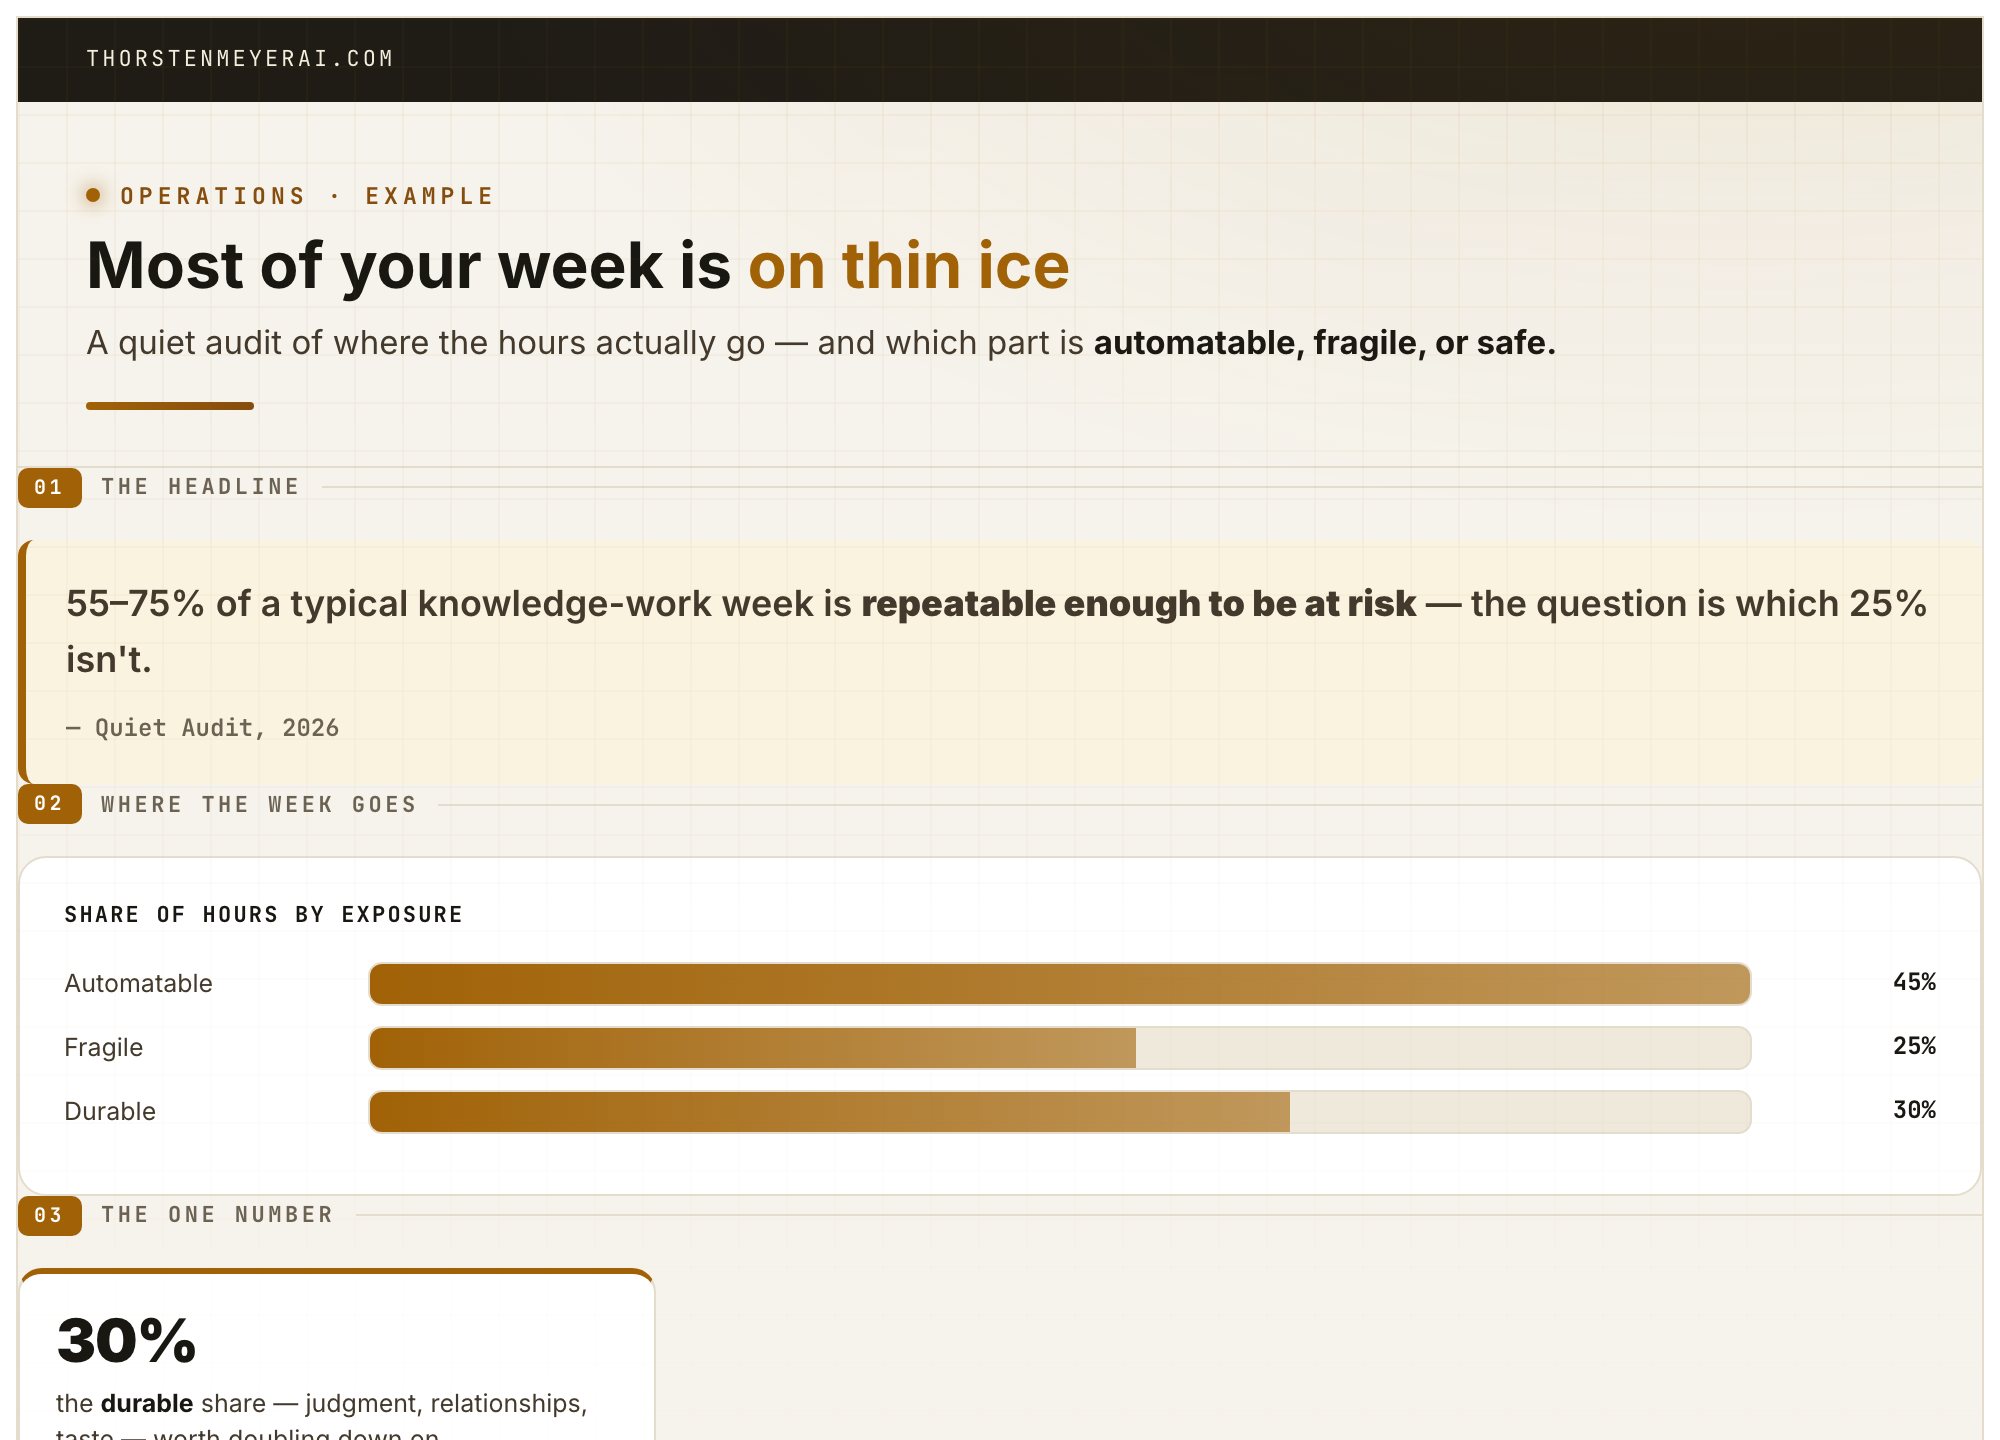
The kind of editorial infographic you'd put in an article — composed automatically from your numbers, with real charts baked in. Self-contained and embeddable straight into WordPress or any page.

Modules
A full visual vocabulary
Metric strips, scorecards, compare tables, before→after reframes, callouts, verdicts, flow diagrams, layer ladders — and real inline charts.
Embed
Drops into WordPress
Each piece is a single self-contained document — paste it into an article and it just works, on any device.
Automatic
Built from your data
Hand it numbers and it composes the story, or give it an exact spec for full editorial control.